
Results 2,801 to 2,825 of 3644
-
12-03-2019, 04:53 PM #2801

 Gravity Slave
- Join Date
- Mar 2012
- Location
- The Bull City
- Posts
- 14,003
It's long past time this became a Spiderman thread..
Go that way really REALLY fast. If something gets in your way, TURN!
-
12-03-2019, 04:53 PM #2802
 Used Register
- Join Date
- Sep 2001
- Location
- Before
- Posts
- 28,021
The scientific community's consensus is real: https://climate.nasa.gov/scientific-consensus/ .
To the extent that the media gets almost as hysterical as Ron, I would grant. Read Cliff Mass.
Green energy has lots of shortfalls and while evolving, is consciously making a trade for pollution against those failures. This is the nature of polemics transforming to paradigms.
Are we done yet?Merde De Glace On the Freak When Ski
>>>200 cm Black Bamboo Sidewalled DPS Lotus 120 : Best Skis Ever <<<
-
12-03-2019, 04:58 PM #2803
Gravity Slave
- Join Date
- Mar 2012
- Location
- The Bull City
- Posts
- 14,003
Go that way really REALLY fast. If something gets in your way, TURN!
-
12-03-2019, 05:06 PM #2804
Banned
- Join Date
- Aug 2019
- Posts
- 1,084
I have well demonstrated that the consensus is imaginary on here. It's not something I'm going to waste my time with again. Go back through the thread if you care, but I'm pretty sure you don't. Originally Posted by dan_pdx

Media propaganda - I'm talking about 90% of the stuff that gets posted on here, which you see me calling out.
The IPCC and other consensus! organizations don't agree that extreme weather is increasing. The study you linked has a useless 36 year sample size.
Green energy - I've posted this multiple times and it pretty well sums up my feelings: https://www.manhattan-institute.org/...ear-impossible
-
12-03-2019, 05:09 PM #2805
 ExteriorDecorator
- Join Date
- Nov 2005
- Location
- Down In A Hole, Up in the Sky
- Posts
- 35,451
OK, Smithers.
Forum Cross Pollinator, gratuitously strident
-
12-03-2019, 05:12 PM #2806
Banned
- Join Date
- Aug 2019
- Posts
- 1,084
Their main source (the Cook paper) has been discredited ad nauseum. The scientific organization statements appear to be a combination of groupthink and political correctness. Originally Posted by Buster Highmen
Sure there is a consensus that earth is warming and humans have an impact, but there is absolutely no consensus on how much warming humans are responsible for or how dangerous it is.
-
12-03-2019, 05:22 PM #2807
 Whoahoho
- Join Date
- Nov 2008
- Location
- Edge of the Great Basin
- Posts
- 5,557
I kinda fell for it too, like maybe he's not so bad but then he linked to his realclimatescience/chart/Iowa video scam. ron is rotten to the core. Originally Posted by dan_pdx
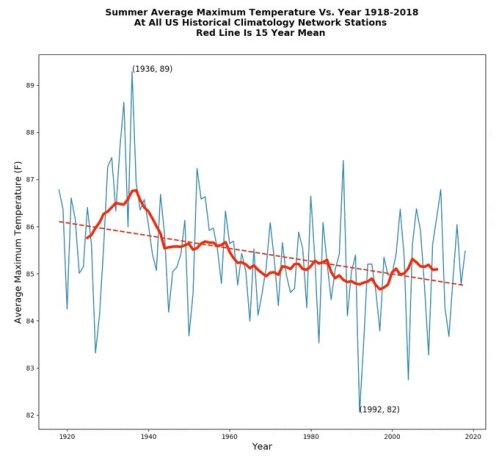
The video/chart uses similar tricks as ron, post decontextualized fact adjacent snippets leaving out key details hoping people will infer, in this instance that temperatures are actually declining, and then make arguments based on his fake data.
The way it works is:
1 - Ignore any nonlinear trend, try to find something like a flat linear trend
1 - Cut out key data
2 - Change the start date
3 - Chop off some of the later warming data
4 - The goal is to get close to as hot as the summer of the Dust Bowl era
5 - Use a naive average, ignoring stations are not equally distributed over the US
6 - Ignore that many weather stations over a century were relocated northward to colder territory
7 - All making it appear like it was warmer in the past
The end result is the faked chart using tortured data ron has been posting here with variations also appearing in his video:
The full explanation
https://tamino.wordpress.com/2018/08...-i-sucker-you/
-
12-03-2019, 05:27 PM #2808
ExteriorDecorator
- Join Date
- Nov 2005
- Location
- Down In A Hole, Up in the Sky
- Posts
- 35,451
“And is there something wrong with changing anyway for the health of the planet? “ Originally Posted by ron johnson
It’s a win-win.
The only downsides are in boardrooms.Forum Cross Pollinator, gratuitously strident
-
12-03-2019, 05:28 PM #2809
 AF
AF
- Join Date
- Feb 2008
- Location
- In a parallel universe
- Posts
- 4,756
Nah, you're a shill, and a koch sucker. Originally Posted by ron johnson
-
12-03-2019, 05:30 PM #2810
 Registered User
- Join Date
- Feb 2008
- Posts
- 2,737
That's a good one. "Useless" in that it shows your claims are factually incorrect? Someone who didn't have their salary riding on this would probably say that significant changes over a relatively short time period like 36 years are a concerning trend, but as always I admire your ability to call black white. Originally Posted by ron johnson
-
12-03-2019, 05:33 PM #2811
Registered User
- Join Date
- Feb 2008
- Posts
- 2,737
So you're saying there's a chance, is that it? Originally Posted by ron johnson

-
12-03-2019, 05:58 PM #2812
ExteriorDecorator
- Join Date
- Nov 2005
- Location
- Down In A Hole, Up in the Sky
- Posts
- 35,451
Hey Ron, you could get a bigger paycheck if you jump ship now.
https://www.washingtonpost.com/busin...ge%2Fstory-ansForum Cross Pollinator, gratuitously strident
-
12-03-2019, 06:04 PM #2813
Gravity Slave
- Join Date
- Mar 2012
- Location
- The Bull City
- Posts
- 14,003
 Go that way really REALLY fast. If something gets in your way, TURN!
-
12-03-2019, 06:28 PM #2814
Used Register
- Join Date
- Sep 2001
- Location
- Before
- Posts
- 28,021
You don't really mean to claim that "their" main source is one paper. Because, no reputable scientist nor even an axe grinding weirdo would make that kind of claim. Originally Posted by ron johnson
That's quite a condemnation of people who have devoted their lives to the pursuit of science. Surely you don't intend to be so crassly received.The scientific organization statements appear to be a combination of groupthink and political correctness.
The question of "How much" is relatively ridiculous since we don't have measures for these things. Not even in metric.
Sure there is a consensus that earth is warming and humans have an impact, but there is absolutely no consensus on how much warming humans are responsible for or how dangerous it is.
Anyway, again, I find you incredibly crass, rude and unable to read graphs or understand basic college freshman math constructs.
When supported by references to people like Cliff Mass, who has been crucified for not sufficiently towing the hysteria line, you continue to lash out in shrill, childish, incorrect and ill informed manners.
That, sir, is no way to convince anyone of anything.Merde De Glace On the Freak When Ski
>>>200 cm Black Bamboo Sidewalled DPS Lotus 120 : Best Skis Ever <<<
-
12-03-2019, 06:38 PM #2815
Banned
- Join Date
- Aug 2019
- Posts
- 1,084
Tony's response: https://realclimatescience.com/2018/...-are-accurate/ Originally Posted by MultiVerse
NopeThe way it works is:
1 - Ignore any nonlinear trend, try to find something like a flat linear trend
Nope1 - Cut out key data
Nope2 - Change the start date
Nope3 - Chop off some of the later warming data
Nope4 - The goal is to get close to as hot as the summer of the Dust Bowl era
Nope5 - Use a naive average, ignoring stations are not equally distributed over the US
Nope6 - Ignore that many weather stations over a century were relocated northward to colder territory
It was warmer in the past (talking summer hot temperatures of course).7 - All making it appear like it was warmer in the past
Nope, nice try though.The end result is the faked chart using tortured data ron has been posting here with variations also appearing in his video:
-
12-03-2019, 06:47 PM #2816
Banned
- Join Date
- Aug 2019
- Posts
- 1,084
Useless because controlling for variance is important. Useless because we have longer data samples that don't find such a trend. Originally Posted by dan_pdx
If I told you that there has been a significant decrease in extreme weather events from 2018 to 2019 (theoretically, I have no idea if this is true) would you find that reassuring or would you tell me that the sample size is too small?
-
12-03-2019, 06:51 PM #2817
 Registered User
- Join Date
- Jan 2008
- Location
- truckee
- Posts
- 23,255
Sure, but exactly HOW do you get rid of those gas burning cars and furnaces, and to you build the massive amount of solar and wnd that will be required. It's not going to happen by magic--what are the specific laws governments need to pass and what are the specific funds governments need to spend to make it happen? The goal is obvious, the steps to reach that goal are not. Originally Posted by WMD
-
12-03-2019, 07:37 PM #2818
Whoahoho
- Join Date
- Nov 2008
- Location
- Edge of the Great Basin
- Posts
- 5,557
From the previous page, ron's/tony's tortured factoid chart is purposely distorting the facts to give a false impression. This what the high temperatures for all four seasons look like separately using NOAA's corrected data. Note how contrary to ron's charts there's an increasing trend for all four seasons:
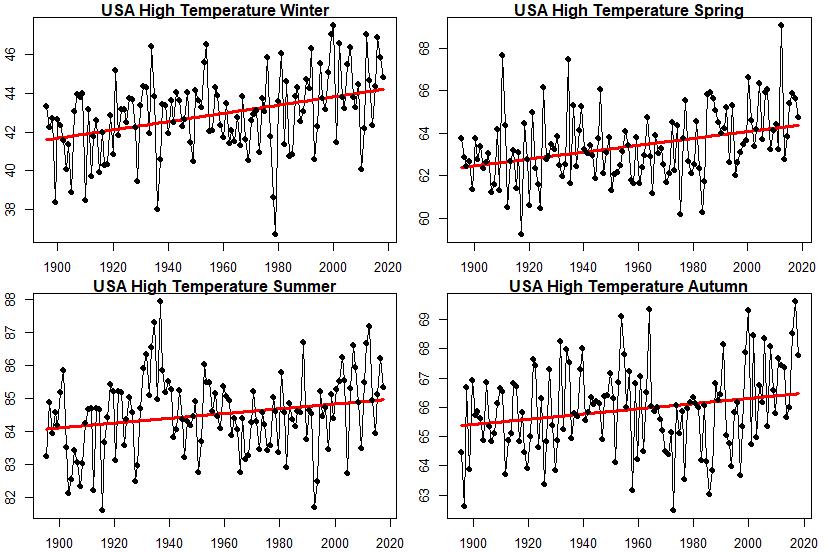
ron's/tony's response says "Tamino Finally Admits That My Graphs Are Accurate" but Tamino says no such thing. In fact, Tamino (a scientist) responds in the original post by pointing out that using corrected data is necessary for the following reasons:
Good luck finding stations that “never really changed.” Even stations that have been in continuous operation have changed methods of observing, which can have a profound effect, in fact time-of-observation bias (TOB) is one of the most important. By the way, by its very nature this bias introduces a trend into the data which, if not corrected for, creates a spurious cooling trend in raw data. Stations have also changed instruments, including the switch from liquid-in-glass thermometers to max/min temperature sensors (MMTS). The people at NOAA do their best to account for all these factors. Of course they haven’t got it perfect, but their efforts represent the best that can be done with present knowledge, based on decades of analysis and experience.
Tony Heller/Steve Goddard does none of this. Rather, he consistently accuses those who do of perpetrating a fraud.
The *point* is that if you ignore the issues altogether, your answer will be WRONG.
The bottom line is ron/tony accuse NOAA of using manipulated data and call it a conspiracy so keep that in mind the next time ron posts a fact adjacent chart or video.
Source:https://tamino.wordpress.com/2018/08...-i-sucker-you/
-
12-03-2019, 07:37 PM #2819
Registered User
- Join Date
- Feb 2008
- Posts
- 2,737
Got a citation for that claim? Originally Posted by ron johnson
As I've said before, you're really letting down society at large by not doing more to bring your novel opinions to the forefront of climate science. You should definitely reach out to these guys and point out the gaping and obvious flaw in their methodology, I'm sure they would appreciate the benefit of your learning. Please share your correspondence with them here so we can learn from the exchange! You can get in touch here: https://easac.eu/contact/
-
12-03-2019, 07:43 PM #2820
ExteriorDecorator
- Join Date
- Nov 2005
- Location
- Down In A Hole, Up in the Sky
- Posts
- 35,451
Don Qui-Hopeless, tilting at windmills.
Forum Cross Pollinator, gratuitously strident
-
12-03-2019, 08:43 PM #2821
 Registered User
- Join Date
- Nov 2006
- Location
- Wyoming
- Posts
- 1,625
Inslee, Warren, Bernie have details on this. From Inslee's plan: Originally Posted by old goat
https://www.vox.com/energy-and-envir...president-2020Getting the carbon out of new carsInslee’s policy focuses on “new light-duty passenger vehicles, medium-duty trucks, and buses,” which together represent about 70 percent of transportation emissions.
The centerpiece here is cranking up CAFE standards until they effectively mandate 100 percent zero-emission vehicles (ZEVs) for all new sales in 2030 forward. (This is, notably, something within the president’s power to do without Congress, though it will by no means be easy or straightforward.)
That core piece is again attended by a host of complementary policies:
a national low-carbon fuels standard (LCFS), which would encourage low-emissions transportation fuels
investments in the US ZEV manufacturing base and in battery recycling
expanded ZEV tax credits and feebates
a “Clean Cars for Clunkers” program that would establish “fuel-economy based trade-in rebates for consumers to exchange their fuel-inefficient cars or trucks for new ZEVs”
rapid electrification of the federal vehicle fleet and efforts to work with states to do the same for state fleets
massive investment in EV charging infrastructure
federal financing for state and local efforts to retire gas and diesel buses in exchange for electric buses (which, as I have argued, are going to be the cutting edge of the EV market)
This stepwise increase in the market for electric vehicles will work in sync with clean electricity to tackle two of the biggest carbon problems at once. And cleaner, quieter vehicles — especially quieting the incessant din of city buses — will provide an immediate and tangible benefit to the public.
This leaves plenty in transportation (notably heavy trucks and airplanes) untouched for now. The campaign promises subsequent policy on that stuff and, crucially, on efforts to reduce vehicle use through urban density and public transit. But this is a solid foundation.
Getting the carbon out of new buildings
Finally, full decarbonization means squeezing the carbon emissions out of buildings, one of the most difficult challenges of all. Efforts on that score have already begun at the state level, including in Washington, and Inslee’s policy builds on those efforts.
The centerpiece is the creation of a national Zero-Carbon Building Standard by 2023, working with states to integrate it into state and local codes, along with stronger federal incentives for states and cities to adopt building “stretch codes.” (Los Angeles recently announced a similar plan, targeting all zero-carbon new buildings by 2030.)
Again, along with that comes a suite of complementary policies:
eliminating fossil fuel use in “all new and renovated federal buildings” by 2023
accelerating appliance energy efficiency standards and promoting zero-emission appliances
establishing tax incentives for energy efficiency and electrification in new residential and commercial construction
increasing financing for upgrades of schools and public buildings
renewing the Energy Efficiency and Conservation Block Grant (EECBG) Program to help fund local zero-carbon construction projects
some even wonkier stuff, about REITs and ESPCs and what have you
The is a push-and-pull approach, with stronger building and efficiency standards pushing and greater federal funding and investment pulling. As I said, it leaves aside the rather more difficult task of what to do about the carbon emissions of existing buildings, but the campaign promises to address that in the next tranche of policies.
Getting into the policy details can make radicalism seem more manageable
The problem with climate debates waged over symbolism is that they encourage everyone to retreat to their identity-based camps and dig in.
Nothing can entirely prevent polarization in these most polarized of times, but one thing that can help dampen it is to take the discussion out of the clouds, out of the realm of competing symbols, and into the dirt and soil of policy work.
Approach a small city and tell it socialists are coming to steal its cows, you’ll get backlash. Tell it there’s a national push to decarbonize buildings underway, and that there will be an array of regulatory sticks and investment carrots ensuring that everyone moves along together, and that the city can prosper — economically and reputationally — by adopting stretch goals and outpacing other cities ... it’s just a different kind of conversation.
Policy, even if people don’t track the details, implicitly makes all the grand goals and targets seem more tangible and achievable. “Decarbonize by 2050” is unwieldy, almost purely symbolic to most people. But a program of sticks and carrots — tightened vehicle fuel-economy and fuel carbon-intensity standards coupled with investments to stand up US ZEV manufacturing capacity and make ZEVs cheaper for consumers — well, that you can wrap your head around. That you can begin to envision.
Policy is how we stop discussing “whether” and start discussing “how.” Mainstream Democrats need to become more fluent in this policy language and familiar with these policy options. Perhaps Inslee’s thoughtful proposals will, if nothing else, spur the other candidates to devote the resources and staffing to this area of policy that it deserves. It’s time to raise the bar.
Bernie's plan will cost $16.3 trillion and "The proposal aims to pay for itself over 15 years. And according to Sanders, the price tag is a bargain compared to the business-as-usual climate trajectory. “Economists estimate that if we do not take action, we will lose $34.5 trillion in economic activity by the end of the century,” according to the plan."
https://www.vox.com/2019/8/22/208273...green-new-dealSeveral 2020 Democrats have called for investment in the trillions of dollars, but in the fine print, these plans include public and private funding. Sanders’ plan is notably different because it calls more more money than any of the other candidates — $16.3 trillion in total — and the entire investment budget would come from federal dollars.
The plan generates money from various sources, including $6.4 trillion in revenue from selling energy via power marketing authorities, $2.3 trillion from income taxes from the new jobs created under the plan, and $1.2 trillion from reducing military expenses related to protecting oil shipping routes.
That money would then be spent across many different clean energy and climate adaptation programs:
$40 billion for a climate justice resiliency fund for under-resourced groups like Native Americans, people with disabilities, and the elderly to prepare for climate change
$200 billion for the United Nations Green Climate Fund to help other countries reduce their emissions
$1.52 trillion to deploy renewable energy and $852 billion for energy storage
$526 billion for an underground high-voltage direct current power transmission network
The proposal aims to pay for itself over 15 years. And according to Sanders, the price tag is a bargain compared to the business-as-usual climate trajectory. “Economists estimate that if we do not take action, we will lose $34.5 trillion in economic activity by the end of the century,” according to the plan.
-
12-03-2019, 08:46 PM #2822
Banned
- Join Date
- Aug 2019
- Posts
- 1,084
Okay so they also cited a non peer reviewed essay from Oreskes that looked at abstracts from 928 papers and concluded that 75% of the abstracts either implicitly or explicity supported the IPCC's view that human activities are responsible for most of the warming over the previous 50 years while non directly dissented. It's worth nothing that only 20% of the papers explicitly endorsed the consensus position and the rest gave no endorsement. - Hardly a consensus. Originally Posted by Buster Highmen
They site the Zimmerman study that found that 82% of scientists responding to their survey "thought that human activity was a significant contributing factor in changing mean global temperatures." - Hardly a consensus.
And finally, they site the Anderegg study which found "97-98% of climate researchers most actively publishing in the field support the tenets of anthropogenic climate change outlined by the IPCC," but that is not without issues: https://www.sciencemag.org/news/2010...nts-says-paper
Do you really think all the members of those organizations have endorsed those statements? It's the administrators making those statements.That's quite a condemnation of people who have devoted their lives to the pursuit of science. Surely you don't intend to be so crassly received.
Here are the results of a survey on climate change sent to the members of the American Meteorological Society:
https://judithcurry.com/2013/11/10/the-52-consensus/
Only 52% of their responding members agree that global warming is happening and is mostly human caused.
It's pretty important, along with how dangerous the warming is. If the question is just is the earth warming and do humans play a role in that warming? - Then I would be a part of the 97% consensus.The question of "How much" is relatively ridiculous since we don't have measures for these things. Not even in metric.
Freshman calc was the end of my math education 15 years ago, sorry for not being familiar with infimum and supremum and least upper bound property.Anyway, again, I find you incredibly crass, rude and unable to read graphs or understand basic college freshman math constructs.
When supported by references to people like Cliff Mass, who has been crucified for not sufficiently towing the hysteria line, you continue to lash out in shrill, childish, incorrect and ill informed manners.
That, sir, is no way to convince anyone of anything.
I have been 100% respectful with anyone who has paid the same respect to me.
-
12-03-2019, 08:49 PM #2823
Registered User
- Join Date
- Nov 2006
- Location
- Wyoming
- Posts
- 1,625
Also, if you aren't hysterical yet you aren't paying attention. This is understandable as RJ and his Koch funders have done a good job of confusing us and hiding the hard truths, but the situation is dire.
"Global greenhouse gas emissions will hit yet another record high this year, experts project“We’re blowing through our carbon budget the way an addict blows through cash,” said one author"
“We’re blowing through our carbon budget the way an addict blows through cash,” Rob Jackson, a professor of Earth science at Stanford University and chair of the Global Carbon Project, said in an interview. “It’s troubling, because carbon dioxide pollution is higher than it’s ever been.”
Global emissions have risen for three consecutive years, at a time when they should be starting to drop sharply if the world is to meet the goals of the Paris climate agreement.Last week, a bleak report from the U.N. Environment Program detailed how off-target the world remains in its collective goal of limiting the Earth’s warming. It said global emissions must fall by nearly 8 percent per year over the next decade to stay in line with the goal of limiting warming to just 1.5 degrees Celsius (2.7 degrees Fahrenheit) above preindustrial levels.https://www.washingtonpost.com/clima...perts-project/The globe already has warmed about 1.1 degrees Celsius (2 degrees Fahrenheit) since the late 19th century, according to separate findings published Tuesday by the World Meteorological Organization.
The WMO also found that 2019 “concludes a decade of exceptional global heat, retreating ice and record sea levels driven by greenhouse gases from human activities,” and added that this year is on pace to be the second- or third-warmest on record.
Tuesday’s report from the Global Carbon Project, published in several journals, including Environmental Research Letters, makes clear that the transformation necessary to rapidly cut greenhouse gas emissions is nowhere in sight.
-
12-03-2019, 09:02 PM #2824
Gravity Slave
- Join Date
- Mar 2012
- Location
- The Bull City
- Posts
- 14,003
I have a hunch that WronG's pal Tony is using Solver to manipulate the data. It would be pretty easy to make changes on the fly that he demonstrated and have Solver massaging the other variables in the background to spit out the desired results based on the inputs where Tony pretends to adjust the variables called and shows results still looking similar. Originally Posted by MultiVerse
Go that way really REALLY fast. If something gets in your way, TURN!
-
12-03-2019, 09:44 PM #2825
Banned
- Join Date
- Aug 2019
- Posts
- 1,084
I believe the title of the post is in jest because 'Tamino' used to accuse him of faking the graphs. But I'm just wondering, why do you find 'Tamino' to be such a credible source? He isn't a scientist like you claim, he is a statistician. I'm sure you had never heard of him before today. Here are some of Tony's posts on TOB adjustments: Originally Posted by MultiVerse
https://realclimatescience.com/2018/...ervation-bias/
https://realclimatescience.com/2019/...ervation-bias/
https://realclimatescience.com/2019/...n-adjustments/

 Reply With Quote
Bookmarks