
so, seeing as maggot wisdom helped me install this thing, i thought i would appeal to the collective again with some questions about how it actually works. i have to do a "project" which is making me feel like a complete idiot.
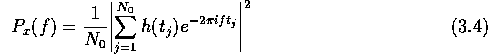
basically i have a set of data that i am supposed to make a periodogram out of. i transformed the original numbers (subtract the mean, fft) and now have a set of wonderful complex numbers, but i don't get how i can plot these against frequencies? how the hell do i get the frequencies? i just don't understand the theory behind this, i guess
also, i am supposed to show that the parseval relation works for these values.
for y=[set;of;numbers;]
sum(y) should be 1/N*sum(y.^2) but it's not.
aaaaahhhh!!
sorry for nerdy nsr post.
any suggestions would be very much appreciated.
Results 1 to 8 of 8
-
01-04-2007, 03:27 PM #1

 heartcore
- Join Date
- Jan 2006
- Location
- Vanity Fair
- Posts
- 2,724
math geeks: MATLAB/statistics help?
Ich bitte dich nur, weck mich nicht.
-
01-04-2007, 04:03 PM #2BLOOD SWEAT STEEL Guest
Thanks for that. I was just thinking how badly I needed my daily reminder of how dumb I am.
-
01-04-2007, 04:17 PM #3

 Seeker of Sastrugi
- Join Date
- Oct 2003
- Location
- The Ranch
- Posts
- 3,792
By the way, you're welcome.
-
01-04-2007, 04:31 PM #4
 Registered User
- Join Date
- Oct 2006
- Location
- Koots
- Posts
- 583
I have seen it in a slightly different expression but that looks right to me. Originally Posted by Ireallyliketoski

Regarding the proof... it might help if we say your data set. If its two big... you should be able to find some sort of algorithum in a text (I can't think of a good on of the top of my head) which you can base off.
-
01-04-2007, 04:46 PM #5
 likes dags

- Join Date
- Mar 2006
- Posts
- 3,452
Parseval's theorem relates the ENERGY of the signal in time with the ENERGY of the signal in freq. Thus, what you wrote (um(y) should be 1/N*sum (y.^2) ) is incorrect, that's why probably itdidnt match.
Second, the frequencies of the periodogram: For every point in the array that Matlab returns you associate a frequency. The maximum of that is 2*pi*(sampling_rate)... or something like that. Each frequency will be MAX_FREQ/i for every i=0:N...
Right now Im speaking from the top of my head. Im too lazy to pull out my undergrad books/Matlab Manual. But it's all pretty easy.... Check your books.
try Y = mx+c
where m = slope
If you want me to do it further, PM me for my e-mail and then send the problem in it's entirety, exactly as stated. Unchanged in wording. All data, all given info, all assumptions, the questions you've been asked to answer, and I can run it for you.Last edited by TacomaLuv; 01-04-2007 at 04:49 PM.
-
01-04-2007, 06:15 PM #6
 knob turner
- Join Date
- Dec 2005
- Location
- in the dark
- Posts
- 2,198
to be a bit more explicit than TLuv - Originally Posted by klar
let's say your orignal data has N samples, and is sampled at times
t = 0:dT: (N-1)*dT
The frequencies of your fft will then be (in 1/s)
f = (0: (N-1))/N/dT
if your 'time' axis is something other than real time, then just substitute appropriate units for dT...
again like Tluv said, what you quoted is not parseval's relation. For matlab's fft, if Originally Posted by klar
Y = fft(y);
then parseval's relation is
sum(abs(Y).^2)/N = sum(abs(y).^2)
don't forget the 'absolute value' bit, since Y will usually be complex.
Good luck.
-
01-04-2007, 07:03 PM #7
likes dags
- Join Date
- Mar 2006
- Posts
- 3,452
Davep makes some good points and makes my rambles a little more clear.
Also, you might want to check out these pages:
http://www.mathworks.com/access/help.../helpdesk.html
Just look for periodogram in the search.
Mathworks is a really helpful reference
-
01-05-2007, 12:48 AM #8
heartcore
- Join Date
- Jan 2006
- Location
- Vanity Fair
- Posts
- 2,724
thanks all!
still not sure i understand the frquency thing, don't have time now, will try again and come back here later
t.luv, thanks for the link, will check it out. as for the offer to do it for me, very very tempting, may get back to you if i really can't figure it out.
you guys rock.Ich bitte dich nur, weck mich nicht.

 Reply With Quote
Similar Threads
-
GPS geeks: Garmin Edge???
By Benny Profane in forum Tech TalkReplies: 1Last Post: 01-07-2007, 10:23 PM -
8th grade math help
By jibij in forum General Ski / Snowboard DiscussionReplies: 30Last Post: 11-29-2006, 02:46 PM -
I flex my math muscles
By Oarhead in forum The Padded RoomReplies: 13Last Post: 12-14-2004, 09:01 AM -
The Monty Hall Problem (paging Math nerds!)
By gincognito in forum TGR Forum ArchivesReplies: 23Last Post: 12-06-2004, 04:16 PM

Bookmarks